
What moved
Markets Pulse
Ownership changes over quarters. Price changes over minutes, and this is where that half lives. Sized by market cap, coloured by performance, so the biggest movers are the biggest blocks rather than the loudest headlines.
Technology sectormarket cap by size, year to date by colour
This is a still image, not a live chart, and it is not ours: it is the MarketCarpet published by StockCharts, captured on 19 August 2026. Nothing on it updates, so read the figures as a snapshot of that moment rather than as today’s market. Open the live version on StockCharts to sort, change the grouping, or hover a ticker.
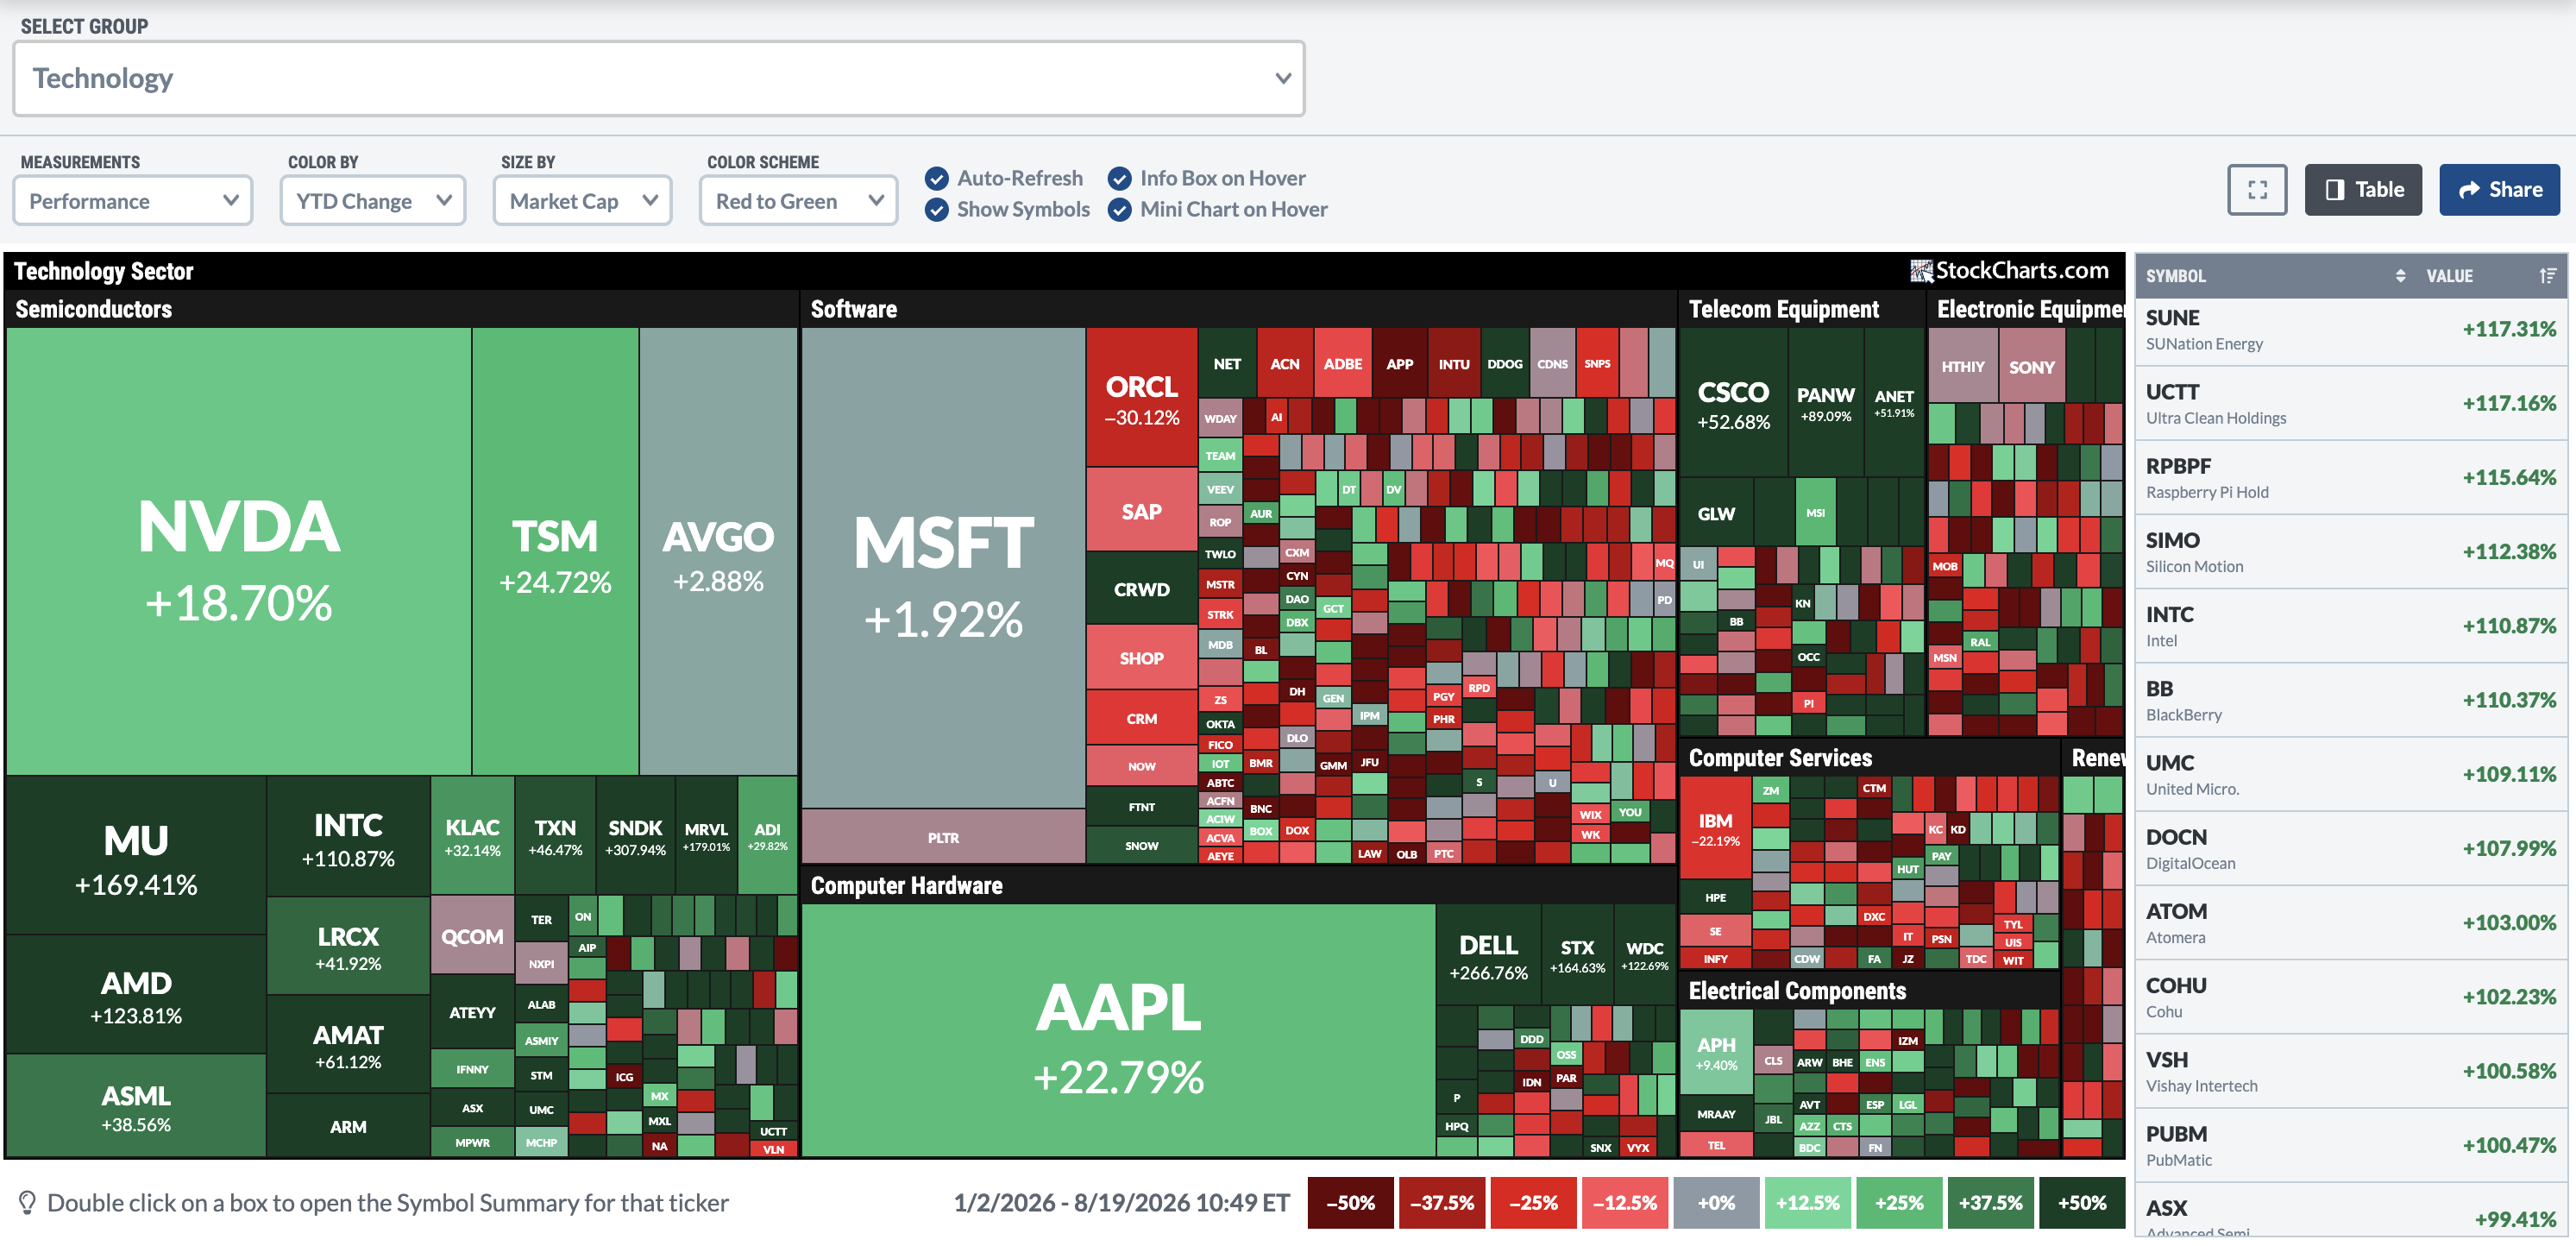
Swipe the map sideways to read the smaller blocks.
Chart and data © StockCharts.com. Reproduced here as a snapshot with attribution and a link to the source. Range shown: 2 January 2026 to 19 August 2026.